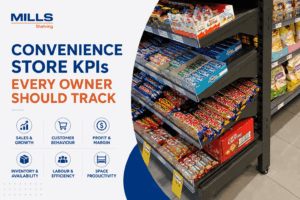
Running a convenience store means keeping track of more than total sales. The right KPIs show whether customers are spending more, which categories are profitable, how efficiently stock is moving and whether your store space is generating enough return.
This guide covers the key convenience store KPIs worth tracking, what they tell you and how to use them to make better decisions.
At Mills Shelving, we see ourselves as more than a shelving supplier. We’re committed to helping Australian convenience store owners make better use of their retail space, improve store performance, and ultimately generate more revenue.
You don’t need dozens of metrics on a dashboard. A smaller group of KPIs can answer most of the important questions about how a convenience store is performing.
| KPI | What It Helps You Understand |
|---|---|
| Total shop sales | Whether overall revenue is increasing or decreasing |
| Number of transactions | Whether more or fewer purchases are taking place |
| Average transaction value | How much the average customer spends |
| Units per transaction | How many products customers buy per purchase |
| Gross profit and gross margin | How much money remains after the cost of products sold |
| Category performance | Which parts of the range are growing, declining or contributing most |
| Sales per square metre | How productively store space is being used |
| Inventory turnover | How quickly stock moves through the store |
| Out-of-stock rate | How often products are unavailable when customers want them |
| Shrinkage and waste | How much stock is being lost rather than sold |
| Labour cost percentage | How much of your sales revenue is being consumed by labour |
The value comes from looking at these numbers together. One KPI can tell you what changed; several related KPIs can often help explain why it changed.
Total shop sales show whether revenue is increasing or decreasing.
Sales growth % = (Current period sales − Previous period sales) ÷ Previous period sales × 100
Use like-for-like comparisons wherever possible. Compare this month with the same month last year, for example, rather than periods with very different trading patterns.
It is also important to track units sold alongside sales value. Higher prices can increase revenue even when fewer products are being sold.
Australian food and non-alcoholic beverage prices were 3.3% higher year-on-year in May 2026, while meals out and takeaway food prices increased 4.0%.
Sales tell you how much customers spent. Units tell you how much product moved. Track both.
Transaction count shows how many purchases are actually taking place.
Compare it with total sales to understand what is driving revenue. If sales increase 5% but transactions fall 3%, for example, higher prices or larger baskets may be responsible rather than an increase in purchasing activity.
It can also be useful to compare transactions by:
These patterns can help with decisions around staffing, stock levels, promotions and opening hours.
For service stations: If your systems provide the data, track how many fuel customers also make an in-store purchase. Strong forecourt traffic does not necessarily translate into strong convenience-store traffic.
These two KPIs show how much customers are buying each time they make a purchase.
Average transaction value = Total shop sales ÷ Number of transactions
If a store generates $50,000 from 5,000 transactions, the average transaction value is $10.
Then compare this with:
Units per transaction = Units sold ÷ Number of transactions
Looking at both provides more context.
Average transaction value is also one of the performance measures used by the Australian Association of Convenience Stores when assessing Australian multi-site convenience retailers.
Look at what customers buy together
Basket data can also show which products are frequently purchased together, such as:
This can inform product placement, promotions and merchandising. If two complementary categories rarely appear in the same basket, consider whether customers can easily find both.
Our guide to convenience store layout ideas that increase sales covers how customer routes, product positioning and promotional areas can support these purchasing behaviours.
Sales show how much revenue a category generates. Gross profit shows how much remains after the cost of the products sold.
Gross profit = Sales − Cost of goods sold
Gross margin % = Gross profit ÷ Sales × 100
Consider two categories:
| Category A | Category B | |
|---|---|---|
| Sales | $20,000 | $15,000 |
| Cost of goods sold | $16,000 | $9,000 |
| Gross profit | $4,000 | $6,000 |
| Gross margin | 20% | 40% |
Category A generates more revenue, but Category B produces more gross profit.
This is why sales alone shouldn’t determine which products receive more stock, promotional attention or shelf space.
The ATO publishes performance benchmarks for Australian grocery retailers and convenience stores. These can be useful for comparing broad cost structures, but they should be treated as a reference rather than a target. Product mix, location, foodservice, trading hours and operating model can significantly affect an individual store’s margins.
Whole-store performance can hide major differences between product categories.
For each important category, monitor:
Australian convenience data released in 2026 demonstrates why this matters. Tobacco sales declined substantially during 2025, while foodservice grew 6.6% and snack foods also recorded growth.
A store heavily exposed to a declining category could therefore report weaker overall sales while other parts of the business are performing well.
Use category data to inform shelf space
Category performance can also help determine how much space different ranges need.
A fast-growing category that regularly sells out may need more facings. A slow-moving range occupying a large amount of shelving may need to be reviewed. High-margin impulse products may benefit from greater visibility or a different position.
“When we work with convenience stores, one of the biggest mistakes is treating every metre of shelving as equally valuable. The products, margins and customer demand are different from one category to the next. Once you understand which categories are actually performing, you can make much better decisions about how much space they should receive and where they should sit in the store.”
Neil Webster, CEO, Mills Shelving
The goal isn’t simply to give the highest-selling category the most space. Consider sales, margin, demand, stock availability and the role the category plays within the overall range.
Convenience-store space is limited, so it helps to know how much return different areas generate.
Sales per square metre = Sales generated ÷ Floor space used
You can take this further by measuring profitability:
Gross profit per square metre = Gross profit generated ÷ Floor space used
For example:
| Area A | Area B | |
|---|---|---|
| Annual sales | $100,000 | $80,000 |
| Gross profit | $20,000 | $32,000 |
| Space | 10 m² | 10 m² |
| Sales per m² | $10,000 | $8,000 |
| Gross profit per m² | $2,000 | $3,200 |
Area A generates more sales, but Area B produces significantly more gross profit from the same amount of space.
The same principle can be applied to linear metres of shelving when comparing categories.
Ask:
Don’t automatically remove every low-performing category. Some products are important destination items or support other purchases even if their direct sales per square metre are lower.
Where performance data shows that categories need more or less space, flexible convenience store shelving makes it easier to adjust shelf heights, facings and capacity as the product mix changes.
Inventory turnover shows how quickly stock is being sold and replaced.
Inventory turnover = Cost of goods sold ÷ Average inventory
Low turnover can indicate excess stock, weak demand or slow-moving products. However, very high turnover isn’t automatically positive.
If a popular drink repeatedly sells out and the shelf remains empty until the next replenishment, the store may still be losing sales.
That is why inventory turnover should be monitored alongside stock availability.
Pay particular attention to:
Repeated stockouts despite having stock in the storeroom may indicate insufficient shelf capacity or slow replenishment rather than an ordering problem.
The aim is simple: keep enough of the right products available without tying unnecessary cash and space up in stock that doesn’t move.
Stock that is stolen, damaged, spoiled or incorrectly recorded reduces the profit generated by products that do sell.
A simple way to monitor this is:
Shrinkage % = Inventory loss ÷ Sales or inventory value × 100
Where possible, separate losses into:
This helps identify the response required. High theft in one category may require changes to security, visibility or positioning. High expiry rates are more likely to point towards ordering or stock-rotation problems.
Track food waste separately
Foodservice requires particularly close monitoring because prepared products have short selling windows.
Australian convenience data released in 2026 showed foodservice sales growing 6.6%, but higher sales do not necessarily mean the category is becoming more profitable if waste is also increasing.
Track:
The goal isn’t necessarily zero waste. Selling out too early can mean missed sales. Aim for enough availability to meet demand without consistently overproducing.
Labour cost percentage shows how much of the store’s revenue is being used to cover labour.
Labour cost % = Total labour costs ÷ Sales × 100
This is particularly relevant in 2026. AACS reported that convenience-sector labour costs increased almost 9% during 2025, while minimum award wages increased another 4.75% from 1 July 2026.
Monitor whether:
You can also track:
Sales per labour hour = Sales ÷ Total labour hours worked
However, lower labour costs aren’t automatically better. Understaffing can result in longer queues, slower replenishment, empty shelves and poorer service.
The aim is to have the right staffing level for the sales and operational workload of each trading period.
A convenience store doesn’t need an enormous dashboard that nobody has time to review.
The purpose of tracking KPIs is to identify changes early enough to do something about them.
A practical review schedule might look like this:
| Frequency | What to Review |
|---|---|
| Daily | Sales, transactions, average transaction value and obvious stockouts |
| Weekly | Category sales, units per transaction, labour, food waste and significant stock discrepancies |
| Monthly | Gross margin, inventory turnover, category profitability, space productivity and longer-term trends |
Your POS, inventory and accounting systems may make some of this information available automatically. Start with the data you can measure reliably rather than creating a complicated reporting system that becomes difficult to maintain.
More importantly, focus on trends and relationships between KPIs, not isolated numbers.
Whenever something moves significantly, ask three questions:
1. What changed? (Identify the KPI and where the movement occurred.)
2. Why did it change? (Look at related data rather than immediately assuming the cause.)
3. What can we change in response? (Turn the finding into a practical decision.)
For example:
A category is growing but repeatedly selling out. Review stock levels, replenishment frequency and whether it needs more shelf facings.
Sales are increasing, but gross margin is falling. Look at product costs, pricing, promotional activity and changes in category mix.
Average transaction value is rising while transactions are falling. Determine whether customers are genuinely spending more or higher prices are masking a decline in purchasing activity.
Foodservice sales are growing, but waste is increasing faster. Review production quantities and when products are prepared throughout the day.
A large section produces relatively little sales or gross profit for its footprint. Review the range, merchandising and amount of space allocated before assuming more products are the answer.
KPIs become valuable when they change what you do next.
At Mills Shelving, we recommend using these KPIs to guide actual changes in your store rather than simply tracking them each month.
If a category is growing and regularly selling out, consider giving it more facings. If a high-margin range is underperforming, review its visibility and position. If an area generates little return for the space it occupies, consider whether that space could be better allocated.
Your shelving should be flexible enough to respond as your product mix and customer demand change. That may mean adjusting shelf heights, changing the number of facings, relocating categories or reconfiguring entire bays.
If your current layout is limiting those changes, Mills Shelving can help configure convenience store shelving around your available space, product range and merchandising requirements.
Want to get more from your convenience store space?
Talk to Mills Shelving about the right shelving configuration for your store.