Research by Mills Shelving
Mills Shelving analysed Australian retail data published by the Australian Bureau of Statistics and Australia Post to identify patterns not immediately visible in the headline figures.
The report examines nominal output per worker, industry performance per active business, quarterly operating conditions and ecommerce expenditure per participating household. Published statistics remain attributed to their original providers.
The per-worker, per-business, cross-indicator and per-household estimates identified as Mills Shelving Original Analysis were calculated from those figures using the methodology explained in this report.
| Derived finding | Result |
|---|---|
| Nominal industry value added per retail worker | Increased approximately 3.8% |
| Nominal retail EBITDA per worker | Increased approximately 4.9% |
| Retail versus overall business growth | Retail growth was 3 percentage points lower |
| Retail income per active business | Approximately $4.25 million in 2024–25 |
| Retail EBITDA per active business | Approximately $339,200 in 2024–25 |
| June 2026 profit–sales movement gap | 5.6 percentage points |
| Online expenditure per participating household | Estimated at $8,429 in 2025 |
The per-worker figures are nominal and have not been adjusted for inflation. The June 2026 movement gap compares a current-price profit measure with a chain-volume sales measure; it shows that the indicators moved in opposite directions but is not a profit margin or like-for-like financial ratio.
Australian retail generated more income, industry value added and EBITDA in 2024–25 despite employing fewer people.
According to the ABS Australian Industry 2024–25 figures, retail employment fell from approximately 1.502 million to 1.494 million, a decline of 0.5%. Over the same period:
These percentage movements were published by the ABS and are presented here as the source data for Mills Shelving’s calculations.
Mills Shelving Original Analysis
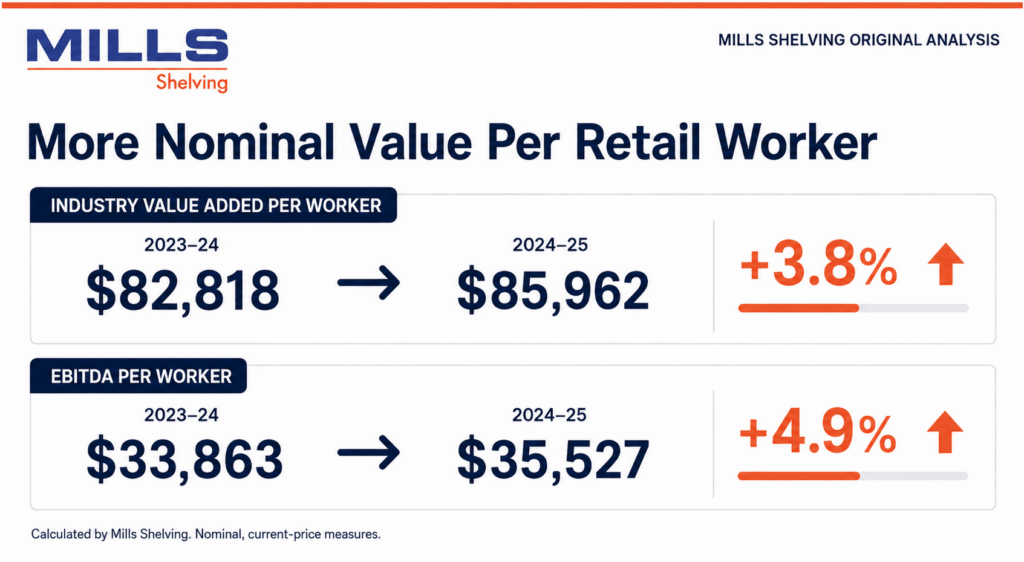
Mills Shelving divided annual retail industry value added and EBITDA by employment for each reporting year.
| Derived metric | 2023–24 | 2024–25 | Change |
|---|---|---|---|
| Industry value added per worker | $82,818 | $85,962 | +3.8% |
| EBITDA per worker | $33,863 | $35,527 | +4.9% |
Mills Shelving calculated that nominal industry value added per retail worker increased approximately 3.8%, while EBITDA per worker increased approximately 4.9% in 2024–25.
Retail employment fell from approximately 1.502 million to 1.494 million over the same period, meaning the industry generated more nominal value and EBITDA with roughly 8,000 fewer workers.
Put another way, growth in retail’s nominal economic output was not accompanied by workforce expansion. More value was being generated across a slightly smaller employment base.
For retailers, this makes operating efficiency increasingly important. When a business cannot rely on continually adding staff, more attention falls on how efficiently existing employees, inventory and selling space are used. Time spent unnecessarily moving stock, replenishing difficult-to-access displays or helping customers locate poorly presented products can become more consequential as more activity is supported by the existing workforce.
These figures are expressed in current prices and have not been adjusted for inflation. They should not be interpreted as measures of inflation-adjusted labour productivity or as proof that individual retail workers became more productive in real terms.
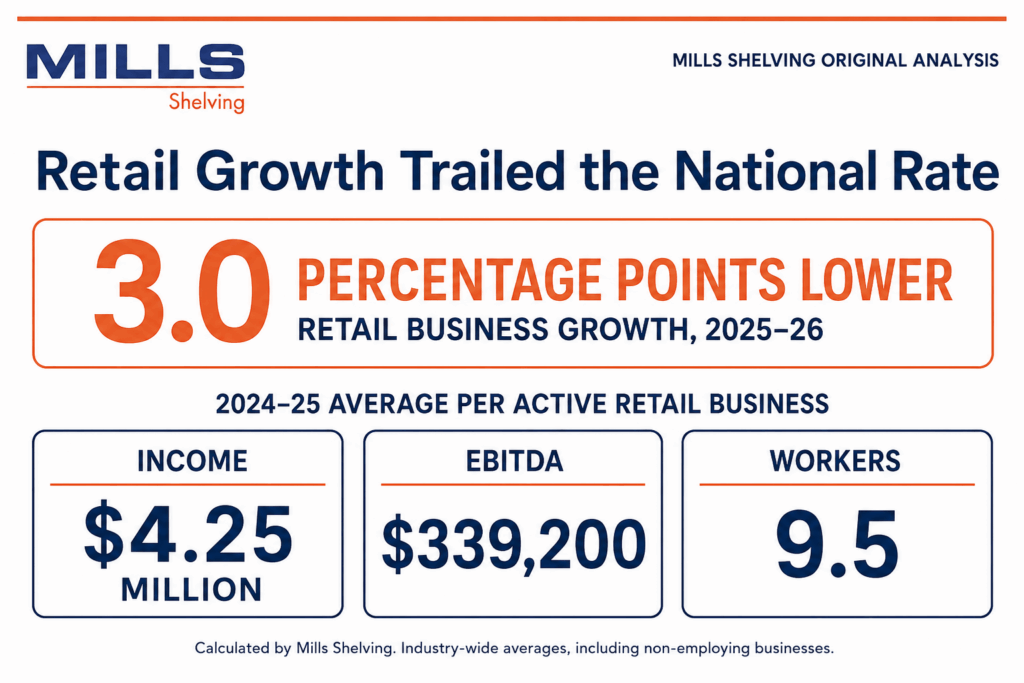
Australia’s retail business population showed almost no growth in 2025–26. The number of actively trading retail businesses increased by 0.1%, while the total Australian business population grew by 3.1%.
Mills Shelving calculated that retail business growth was therefore 3 percentage points below the national rate.
Another way to put that difference into perspective is that the overall Australian business population grew at approximately 31 times the rate of the retail business population during the year.
This followed an outright contraction in the previous year, when the retail business population fell by 0.4%. Together, the figures point to a retail sector whose business population has remained broadly flat rather than expanding rapidly.
In 2024–25, the retail business population fell from 156,785 to 156,169 actively trading businesses. The underlying ABS data recorded 24,222 entries and 24,838 exits, producing a net decline of 616 retail businesses.
The result followed a contraction in the previous year. The retail business population declined by 0.4% in 2024–25, falling from 156,785 to 156,169 actively trading businesses. The underlying ABS data recorded 24,222 retail business entries and 24,838 exits, a net decline of 616 businesses.
What Did Each Active Retail Business Support?
To examine the industry beyond its business count, Mills Shelving combined the average number of active retail businesses during 2024–25 with matching retail income, EBITDA and employment figures.
The average business count was calculated as follows:
(156,785 + 156,169) ÷ 2 = 156,477
Mills Shelving Original Analysis
| Derived measure | 2024–25 result |
|---|---|
| Income per active retail business | Approximately $4.25 million |
| EBITDA per active retail business | Approximately $339,200 |
| Workers per active retail business | Approximately 9.5 |
The calculations use the ABS retail industry totals for income, EBITDA and employment and the average 2024–25 retail business count.
Mills Shelving’s analysis indicates that retail income and EBITDA increased in 2024–25 even as business numbers and employment declined. The increase in nominal economic activity therefore occurred within a slightly smaller business and employment base rather than through an expansion in the number of retailers or workers.
At an industry level, each active business represented in the calculation corresponded to approximately $4.25 million in annual income, $339,200 in EBITDA and 9.5 workers.
These figures should not be treated as the profile of a typical individual shop. However, they illustrate the scale of commercial activity being supported by Australia’s existing retail business base.
Combined with the near-flat growth in retail business numbers, the figures shift the practical question for established retailers from simply “How do we expand?” towards “How do we generate more value from the capacity we already have?”
That includes the productivity of existing locations, employees, inventory and customer traffic. For a physical retailer, decisions about stock capacity, replenishment, merchandising and the productive use of floor space therefore become part of the broader efficiency question.
These figures are industry-wide averages, not the performance of a typical retailer. The business count also includes non-employing businesses.
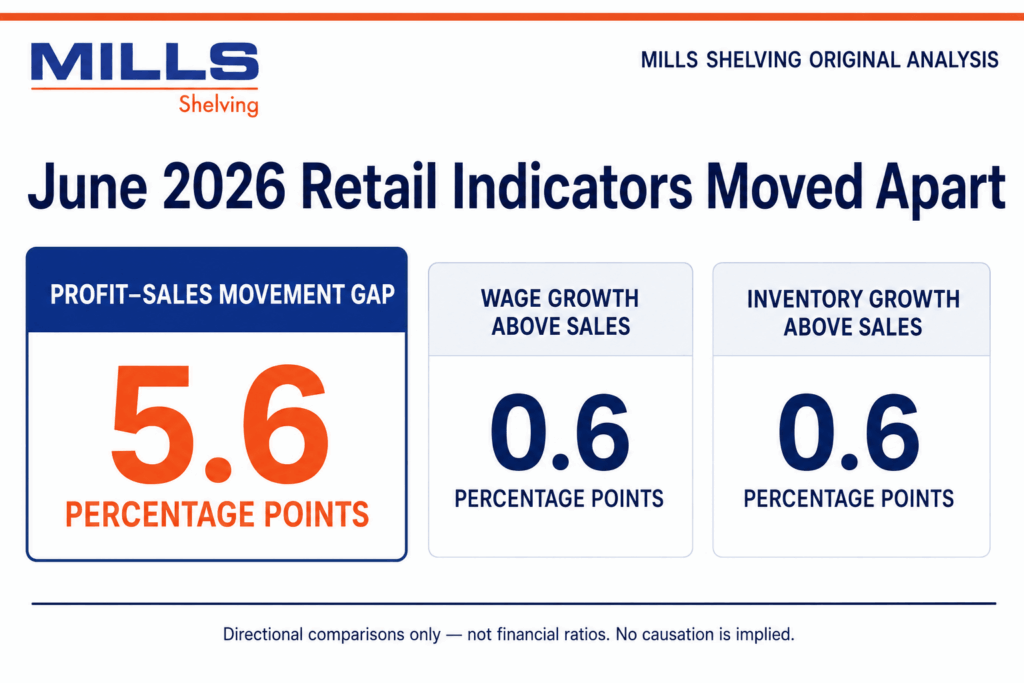
Australian retail sales moved higher in the June 2026 quarter, but company profits moved sharply in the opposite direction.
The ABS quarterly retail indicators reported the following movements:
June 2026 Retail Snapshot
Sales
+0.4% ↑
Wages
+1.0% ↑
Inventories
+1.0% ↑
Company profits
−5.2% ↓
Mills Shelving Original Analysis
Mills Shelving compared the direction and size of the reported quarterly movements.
The difference between sales growth of 0.4% and the 5.2% decline in company gross operating profits was 5.6 percentage points.
Wages and inventories also grew 0.6 percentage points faster than sales during the quarter.
Mills Shelving’s analysis found a clear separation between retail activity and profitability in the June 2026 quarter. Sales increased by 0.4%, while company gross operating profits fell by 5.2%, creating a 5.6-percentage-point difference in their reported movements.
The practical significance is that higher retail activity did not coincide with stronger aggregate company profits during the quarter. Retailers collectively sold more, yet the reported profit measure moved sharply in the opposite direction.
This matters because sales growth on its own does not show whether a retail business is becoming economically stronger. A store can generate additional turnover while also requiring more labour, carrying more inventory, discounting more heavily or incurring other operating costs that reduce the financial value of that growth.
The June quarter therefore highlights an important distinction between selling more and operating more efficiently.
For retailers, growth initiatives should be assessed not only by whether they increase revenue, but by what is required to produce that revenue. Measures such as labour requirements, stockholding, inventory turnover, gross profit and sales generated from available floor space can provide a more complete view than turnover alone.
The ABS figures do not establish that higher wages or inventories caused the decline in profits. They show only that these indicators moved differently during the quarter.
The measures are also not directly equivalent: company profits and wages are reported in current prices, while sales and inventories are chain-volume measures. The 5.6-percentage-point result should therefore be treated as a directional comparison, not a profit margin or like-for-like financial ratio.
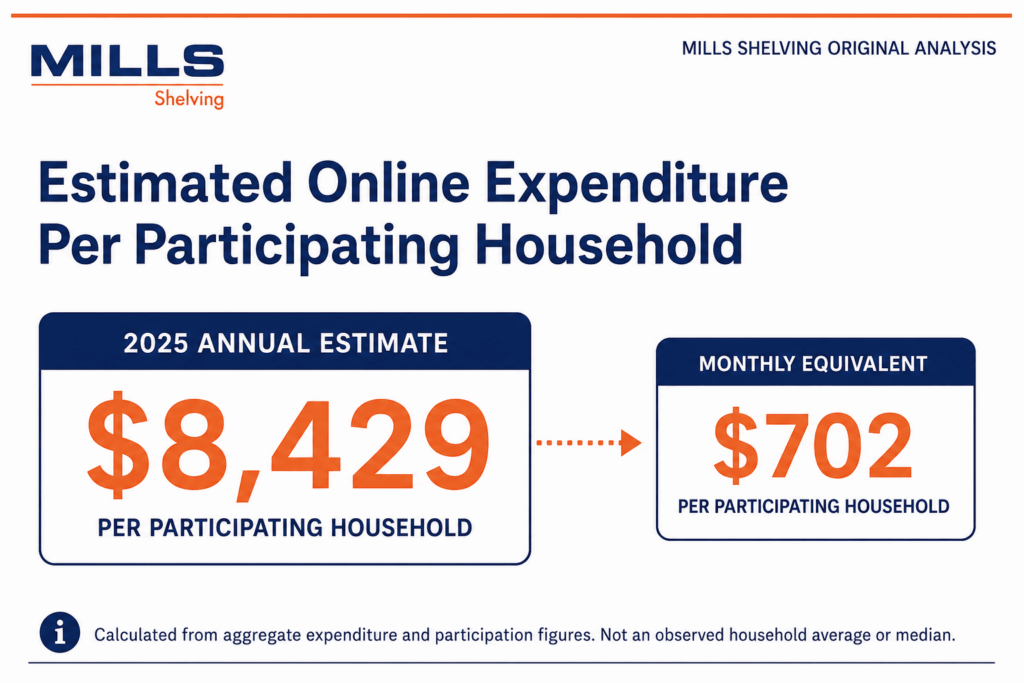
Online retail reached a new high in 2025. Australians spent $82.6 billion online, an increase of 14%, according to Australia Post.
Participation also reached record levels:
These figures were published by Australia Post and form the inputs for the following estimate.
Mills Shelving Original Analysis
Mills Shelving divided total online expenditure by the number of participating households:
$82.6 billion ÷ 9.8 million households = $8,429
This is equivalent to approximately:
Australia Post also reported an average online basket value of $96. Using that figure purely as a benchmark, $8,429 in annual expenditure would be equivalent to approximately 88 average-sized online baskets per participating household per year, or around 7.3 per month.
This is an illustrative calculation rather than an observed household purchase frequency. Individual households differ substantially in both how often they buy online and how much they spend per transaction.
Mills Shelving estimates that Australia’s online-shopping households accounted for approximately $8,429 in ecommerce expenditure each during 2025. The result shows the scale of online spending among households that participated in ecommerce, not the spending of every Australian household.
At approximately $162 per week, online purchasing is no longer an occasional retail channel for many participating households. It represents a substantial and recurring part of consumer spending behaviour.
However, Australia Post reported that ecommerce represented 24% of total retail spending. Under that measure, approximately three-quarters of retail expenditure still occurred outside online channels.
The implication is therefore not that physical retail has been displaced. Rather, physical stores remain commercially significant while competing with a digital channel built around convenience, product discovery, comparison and ease of navigation.
For bricks-and-mortar retailers, this increases the importance of making the physical shopping experience similarly easy to navigate. Customers should be able to identify product categories, locate stock, compare alternatives and move through the store without unnecessary friction.
This is a calculated estimate based on aggregate expenditure and participation figures. It is not an observed average or median household result, and individual spending will vary considerably.
More growth is being supported by the industry’s existing capacity. Retail business numbers barely increased in 2025–26 after declining the previous year, while employment also fell in 2024–25. At the same time, nominal industry value added and EBITDA increased. The retail sector is therefore generating more economic activity without equivalent expansion in the number of businesses or workers supporting it.
For established retailers, that increases the value of getting more from existing resources before simply adding more of them. The commercial question becomes how effectively current staff, stores, inventory and customer traffic are being used.
Higher sales do not automatically mean stronger economics. The June 2026 quarter provides a clear example. Retail sales increased 0.4%, yet company gross operating profits fell 5.2%. The figures cannot establish why profits declined, but they demonstrate why turnover should not be viewed in isolation.
Retailers need to consider what additional sales require in terms of labour, inventory, floor space and operating cost. Growth that requires disproportionately more resources may be less valuable than growth achieved through better use of existing capacity.
Physical retail remains significant, but expectations are increasingly shaped by ecommerce. Australians spent $82.6 billion online in 2025, equivalent to an estimated $8,429 for every household that participated in ecommerce. Yet online purchases represented 24% of total retail spending under Australia Post’s measure, leaving the majority of retail expenditure outside ecommerce.
Physical stores therefore remain an important part of Australian retail. The challenge is making those stores easier and more productive to use while consumers become increasingly accustomed to the convenience and navigability of online shopping.
That makes operational efficiency a commercial issue, not simply a cost-cutting exercise. Efficient retailing can involve reducing unnecessary staff movement, improving stock accessibility, simplifying replenishment, making products easier for customers to find and increasing the amount of productive selling capacity available within an existing footprint.
This is where store layout and shelving become relevant. Shelving does not create productivity by itself, but it influences how inventory is displayed, accessed and replenished, how easily customers can navigate a store and how effectively each square metre of available retail space can be used.
For retailers reviewing an existing store or planning a new one, the objective should therefore not simply be to fit more products into the space. It should be to create a layout that helps the available space, stock and workforce contribute more effectively to the operation of the business.
Mills Shelving supplies retail shelving systems designed to support product visibility, stock capacity, replenishment and the productive use of retail floor space.
Taken together, the findings point to a retail sector generating more nominal economic activity through a relatively stable business base and slightly smaller workforce, while short-term sales growth does not necessarily translate into stronger profits. At the same time, ecommerce now accounts for substantial household expenditure without replacing the commercial importance of physical retail.
Mills Shelving combined publicly available datasets from the Australian Bureau of Statistics and Australia Post. No surveys, proprietary client information or estimated industry datasets were used.
Data Used
The per-worker calculations use ABS Australian Industry 2024–25, including retail employment, income, industry value added and EBITDA.
The per-business calculations combine those figures with the ABS count of actively trading retail businesses for 2024–25. The 2025–26 business-growth comparison uses the subsequent ABS business-count release.
Quarterly sales, wages, inventories and company-profit movements come from ABS Business Indicators for June 2026.
The household estimate combines the total expenditure and participation figures published in the Australia Post eCommerce Report 2026.
Calculations
Per-worker measures
Industry value added per worker = Retail industry value added Retail employment
EBITDA per worker = Retail EBITDA Retail employment
Average active retail business count
Opening business count + Closing business count 2
Per-business measures
Income, EBITDA or employment ÷ Average active retail business count
Business-growth gap
3.1% overall growth − 0.1% retail growth = 3.0 percentage points
June 2026 movement gap
0.4% sales movement − (−5.2% profit movement) = 5.6 percentage points
Online expenditure per participating household
$82.6 billion ÷ 9.8 million households = $8,429
Interpretation and Limitations
Financial figures from ABS Australian Industry are reported in current prices. The per-worker results therefore measure changes in nominal value and EBITDA, not inflation-adjusted labour productivity.
Per-business results are industry-wide averages and include non-employing businesses. They should not be interpreted as the results of a typical or median retailer.
The June 2026 comparison combines current-price profit and wage measures with chain-volume sales and inventory measures. It illustrates the direction and difference between the reported movements but is not a financial ratio.
Results have been rounded for readability. Calculations were performed using the most detailed figures available before rounding.
This report uses publicly available data from the Australian Bureau of Statistics and Australia Post. Mills Shelving used the following sources to complete its calculations and analysis: