Walk into any retail store, and the outcome is often decided in seconds, not minutes.
The average shopper spends just 13 seconds choosing a product. That window is small, which means visibility, placement, and accessibility carry more weight than brand messaging or detailed comparisons. If a product is not immediately seen or easily reached, it is often ignored.
Impulse behaviour reinforces that point. Around 84% of shoppers have made impulse purchases, and roughly 8 out of 10 of those happen inside physical stores. The environment itself drives the decision. Layout, shelf height, and product exposure act as triggers that influence what ends up in the basket.
Retail performance, in practical terms, is not just about what you sell. It is about where and how you present it.
Every effective layout starts with a simple premise: shoppers do not browse logically; they react visually.
A growing number of customers now combine physical and digital behaviour during their visit. Around 20% of shoppers use their phones in-store to support purchase decisions. Price checks, reviews, and product comparisons happen alongside shelf browsing. That creates a layered decision process where visibility still determines which products even enter consideration.
At the same time, there is a clear disconnect between how stores are designed and how customers actually shop. More than 55.75% of shoppers perceive store layouts as poorly designed.
That figure is not just about aesthetics. It reflects friction.
When layout creates friction, shoppers either default to familiar items or leave without purchasing. Both outcomes limit revenue.
For retailers, the implication is direct. Layout decisions should not be based on preference or tradition. They should reflect how customers actually move, scan, and decide in-store.
Once behaviour is understood, the next layer is movement. How customers travel through the store determines what they see and what they miss.
Retailers that analyse customer movement through tools such as heatmaps consistently see measurable gains. Optimised layouts can increase sales by 5–10% and improve conversion rates by up to 20%.
Those gains come from small but cumulative improvements.
Even incremental changes in placement can shift outcomes. Positioning products in high-traffic areas increases customer engagement by up to 15% and extends dwell time in those zones by 10–15%. More time spent in a zone leads to more product exposure, which increases the likelihood of purchase.
Layout structure plays a critical role in enabling this. Grid layouts guide shoppers efficiently through aisles, loop layouts encourage full-store exploration, and free-flow layouts create discovery-driven experiences. Each format shapes behaviour differently, as outlined in different types of retail store layouts.
Execution matters just as much as design. A layout that looks clean on paper can fail if it does not align with real movement patterns. Retailers that succeed treat layout as a performance system, not a visual one.
For stores investing in long-term optimisation, resources such as how to create an inviting retail store layout provide a practical framework for aligning design with shopper behaviour.
Once customers are moving through the store, attention shifts to what they actually see. That is where shelf positioning becomes one of the most powerful drivers of sales.
Products placed within the 50 to 54 inch range, often referred to as the eye-level zone, achieve the highest interaction rates. This is the natural line of sight for most shoppers. Items placed here require no effort to notice or reach, making them the most commercially valuable positions in the store.
Move outside that zone, and performance drops quickly. Products placed below 30 inches, in the so-called stoop zone, experience significantly lower visibility and interaction. Shoppers need to bend or actively search, which introduces friction and reduces engagement.
The same applies at the top end. Items positioned above 60 inches often suffer from reduced visibility due to reach limitations and lighting constraints.
Put simply, not all shelf space is equal.
From a commercial perspective, shelf height should be treated as a pricing mechanism. The most valuable products, whether driven by margin or demand, belong in the most visible zones. Lower and higher shelves serve a supporting role rather than a primary one.
This is where systems such as gondola shelving become particularly effective. Adjustable configurations allow retailers to control vertical placement with precision, ensuring high-priority products consistently sit within optimal viewing zones.
Across broader store environments, including retail shelving and supermarket shelving setups, the same principle applies. Visibility drives interaction, and interaction drives sales.
Positioning alone is not enough. Execution determines whether the intended strategy translates into results.
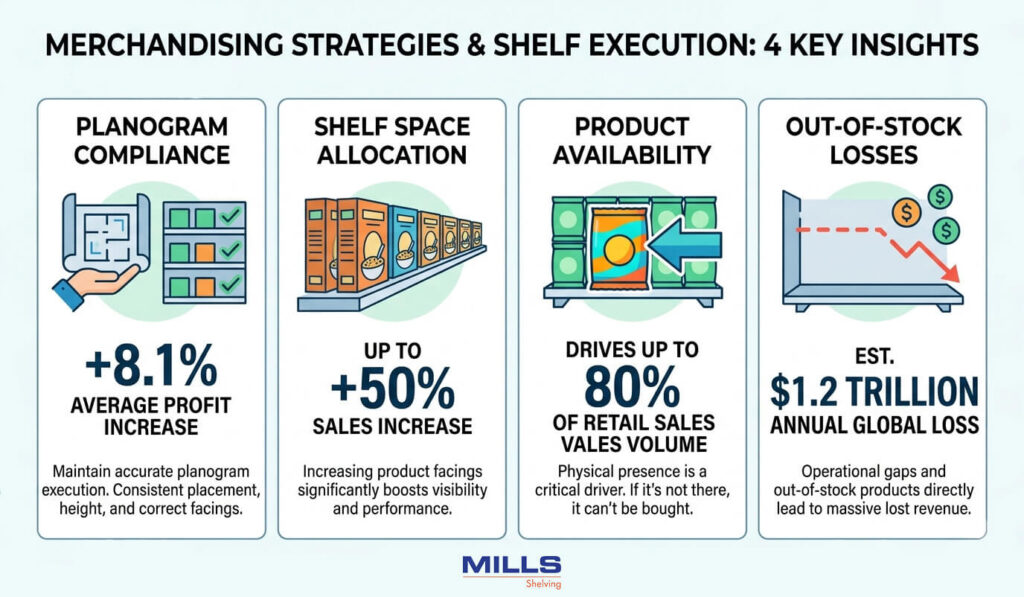
Planogram compliance is one of the clearest indicators of this. Retailers that maintain accurate planogram execution see an average profit increase of 8.1%. That uplift comes from consistency. Products are placed where they are expected to be, at the right height, with the correct number of facings.
Shelf space allocation adds another layer. Increasing the number of facings for a product can significantly boost performance, with some cases showing sales increases of up to 50% before reaching diminishing returns. More facings increase visibility and perceived availability, both of which influence purchase decisions.
Availability itself is one of the most critical drivers. Up to 80% of retail sales volume is driven by products that are physically present on the shelf. If a product is not there, it cannot be purchased.
The scale of the issue is significant. Retailers lose an estimated $1.2 trillion annually due to out-of-stock products. That figure highlights how operational gaps at the shelf level directly translate into lost revenue.
For teams managing physical stores, these are not minor details. Shelf execution is where strategy either succeeds or fails.
Not all shelf positions are created equal, but some locations outperform standard shelving by a wide margin. These are the zones where attention, timing, and convenience intersect.
End-of-aisle displays are one of the clearest examples. Rear endcaps can generate an average 416% increase in brand sales, while front endcaps drive around 346% uplift.
Those numbers are not marginal gains. They reflect a structural advantage.
Endcaps sit directly in the shopper’s path. They interrupt movement, create visibility from multiple angles, and reduce the effort required to engage with a product. In practical terms, they function as decision points rather than browsing spaces.
Checkout zones operate in a similar way, but at a different stage of the journey. Relocating products to displays near checkout areas can increase sales by between 80% and 478%.
The reason is timing.
At checkout, intent is already high. The shopper has committed to purchasing. Adding a well-positioned product at that moment removes friction and creates an easy, low-effort decision.
From a merchandising perspective, these high-impact zones should not be treated as overflow space. They are premium real estate.
Retailers that actively manage these placements tend to see disproportionate returns compared to standard shelf optimisation alone.
Retail execution is moving away from static planning and towards continuous optimisation.
A large majority of senior retail leaders are already adjusting their approach. Around 86% of C-suite executives plan to increase investment in AI-driven retail execution.
That shift is driven by a clear limitation in traditional methods.
Manual checks, periodic audits, and static planograms cannot keep up with real-time changes in demand, stock levels, and shopper behaviour. As a result, gaps form between strategy and execution.
Data-driven systems close that gap.
They allow retailers to:
In practice, this moves retail from reactive to proactive.
For example, instead of identifying a stock issue after lost sales, systems can flag the problem early and prompt immediate action. Instead of relying on periodic layout reviews, retailers can continuously refine positioning based on movement data and conversion trends.
For operators working with physical fixtures such as gondola shelving, this creates a more flexible and responsive environment. Shelf heights, facings, and product groupings can be adjusted quickly to reflect real performance data rather than fixed layouts.
The result is not just efficiency. It is consistency at scale.
Taken together, the data point to a clear conclusion. Store layout and shelf positioning are not secondary considerations. They are primary drivers of retail performance.
Shoppers make decisions quickly. They rely on what they see first, what is easiest to access, and what fits naturally into their path through the store. Visibility and placement determine which products are even considered.
At the same time, execution gaps remain widespread.
More than half of shoppers still perceive store layouts as poorly designed. That indicates missed opportunities across navigation, product placement, and overall store experience.
The commercial impact of those gaps is significant.
On the other side, the upside is equally clear.
Retailers that align layout with behaviour, position products within high-visibility zones, and execute merchandising consistently see measurable improvements in engagement, conversion, and revenue. Even small adjustments, such as increasing facings or repositioning key products, can produce meaningful gains.
From a practical standpoint, the focus should be on control.
Store layout, shelving systems, and product placement are all variables that retailers can actively manage. Investing in the right infrastructure, such as adaptable retail shelving systems, gives teams the flexibility to implement and refine these strategies over time.
For those operating in structured environments like supermarkets, where volume and efficiency are critical, supermarket shelving setups that support clear zoning and visibility become even more important.
The direction of travel is clear.
Retail is becoming more data-driven, more responsive, and more focused on execution at the shelf level. The stores that perform best are not necessarily the ones with the widest range, but the ones that present their products in the most effective way.
In a market where attention is limited and competition is high, layout is no longer just part of the store. It is the strategy.